Economic Environment
Productivity rates in manufacturing continued to contact for the second consecutive year, with higher energy, finance costs and taxation increasing pressure. As a result, the negative investment evironment, reflected in investment stagnation, unemployment at 24% and reduced consumption, emained unchanged.
On an international level, developments in the energy sector were driven by the significant drop in global crude oil prices and sustained supply surplus, despite important geopolitical changes, resulting in notable pressure mainly in the upstream Oil & Gas industry.
In the refining sector - in particular European refineries – despite there being a recovery in international refining margins, competitiveness has continued to suffer from the high cost of compliance, due to the EU climate policy regulation. Competitive pressure faced by Greek refineries is expected to increase further due to the development and modernization of refining capacity in neighboring countries, the Middle East and Southeast Asia, which will not incur the high costs of EU regulatory compliance.
2015 was also a challenging year in which difficult decisions had to be made in order to address the increased challenges faced by HELLENIC PETROLEUM Group, on the one part due to the international environment and on the other, because of the urgent need to re-design and structure the Group in order for it to adapt to the new conditions formed from the prolonged recession and deterioration of the Greek economic environment.
In 2015, domestic fuels demand amounted to 7.1m tones (according to preliminary official data posting an increase of 7% versus 2014) mainly as a result of the significant consumption increase (+43%) in heating gasoil. Demand for transport fuels remained at the same level, with diesel recording gains of 3%, offsetting corresponding losses in gasoline, as the deteriorating economic environment in the second half resulted in the reversal of the positive trend witnessed in the first half.
Main Business Indicators
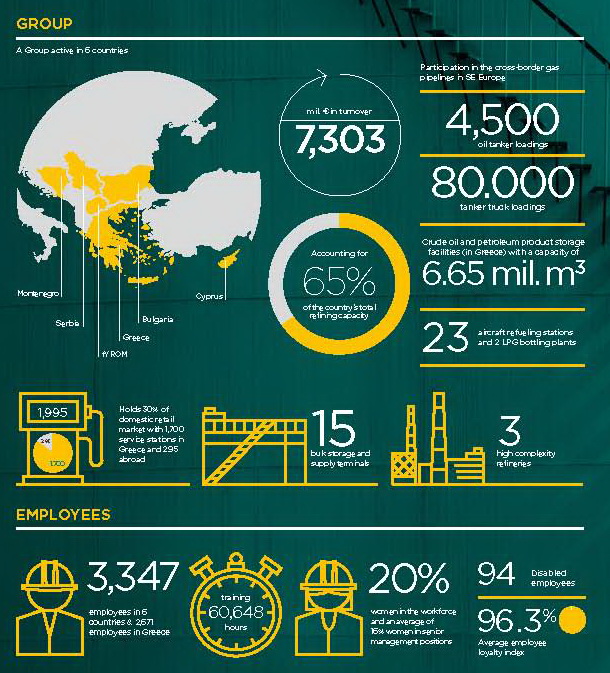
The tables below present the Group’s main financial and operational indicators for 2015:
| Operational Data |
2015 |
2014 |
| Refinery sales (in mil. metric tons) |
14.26 |
13.54 |
| Marketing sales (in mil. metric tons) |
4.67 |
4.13 |
| Refinery production (in mil. metric tons) |
12.79 |
12.46 |
| Group employees |
3,300 |
3,288 |
| Financial Data (€ m) |
2015 |
2014 |
| Turnover |
7,303 |
9,478 |
| Adjusted EBITDA |
758 |
417 |
| Adjusted Net Income |
268 |
2 |
| Net Income |
45 |
(369) |
| Capital Employed |
2,913 |
2,870 |
| Net Debt |
1,122 |
1,140 |
| Gearing Ratio |
39% |
40% |
The Group recorded a significant improvement in its operating results, with Adjusted EBITDA reaching €758m (2014: €417m), the highest operating result ever, as operational performance improved in all of the Group’s activities, especially Refining, Supply & Trading.
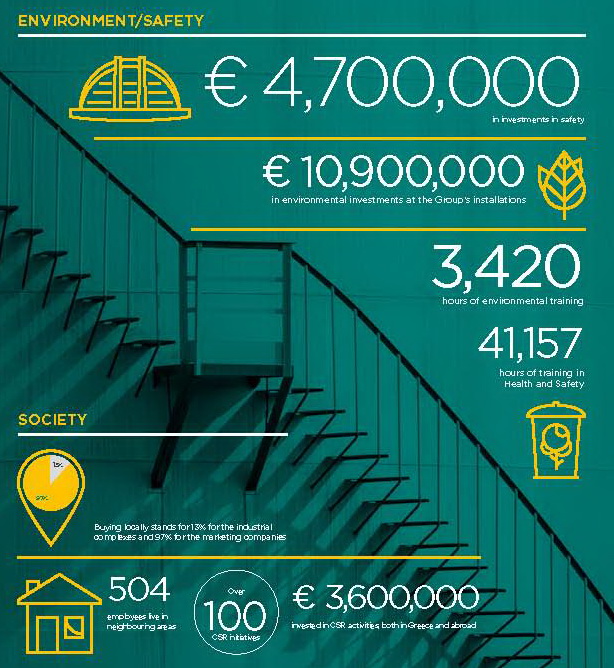
Performance Summary (The Group in numbers)

